Biomarker Analysis by 2D Electrophoresis and Image Analysis
Biomarker Searching
Biomarker Analysis by 2D Electrophoresis and Image Analysis
■ Analysis of Biomarkers in Diabetes Model Mouse Serum
Protein expression in an organism is known to exhibit specific changes due to cancer or other diseases.
One method for determining the quantitative and qualitative changes in proteins is to detect differentially expressed proteins through a combination of high-resolution 2D electrophoresis and high-resolution gel image analysis of the proteins extracted from normal and diseased areas, followed by analysis and identification of the differentially expressed proteins using a high-sensitivity MALDI-TOF MS system. These methods are introduced below.
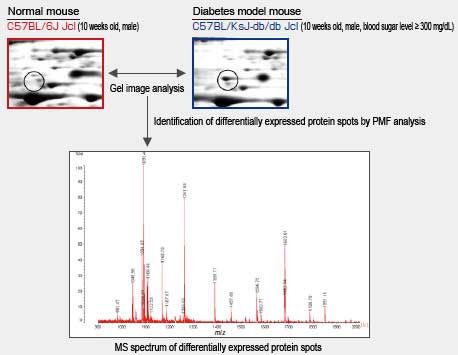
This is an example of the analysis of biomarkers in diabetes model mouse serum.
In the serum of the diabetes model mouse, the circled spot shows significantly increased density, probably resulting from increased protein expression.
Separation by 2D gel electrophoresis, gel image analysis (spot matching, detection of changed spots), MALDI-TOF MS analysis, and Mascot database searching on normal mouse/diabetes model mouse serum proteins identified acylation-stimulating protein as one mobilizing factor in the diabetes model mouse.

Electrophoresis/Image Analysis and MS Spectrum of Differentially Expressed Proteins
AXIMA Performance MALDI-TOF MS

The AXIMA Performance is one of the most powerful tools in mass spectrometry, delivering information-rich spectra with greater sensitivity and higher confidence in identification. It is an extremely versatile and powerful TOF-TOF system, integrating workflows for a diverse range of analytical needs.
- From high energy MS/MS of proteomics and other biological and organic samples to uncompromised analysis of high mass intact proteins
- True high energy MS/MS - CID with a laboratory frame collision energy of 20keV
- Optimal precursor ion selection resolution using revolutionary gating technology
- Outstanding sensitivity - uncompromised design, to ensure no MS/MS signal is discarded


