UV-1900i Plus - Applications
UV-Vis Spectrophotometer

Most of the documents on the LITERATURE is available in PDF format. You will need Adobe Acrobat Reader to open and read PDF documents. If you do not already have Acrobat Reader, you can download it free at the Adobe's Website. Click the GET ADOBE READER icon on the left to download a free copy of Adobe Acrobat Reader.
Food
- This is an example of the analysis of food dyes. By using ultra-fast scan mode, the time needed for routine spectral checks can be shortened. The 350 nm to 900 nm region can be measured at 1 nm intervals in approx. 4 seconds.
-
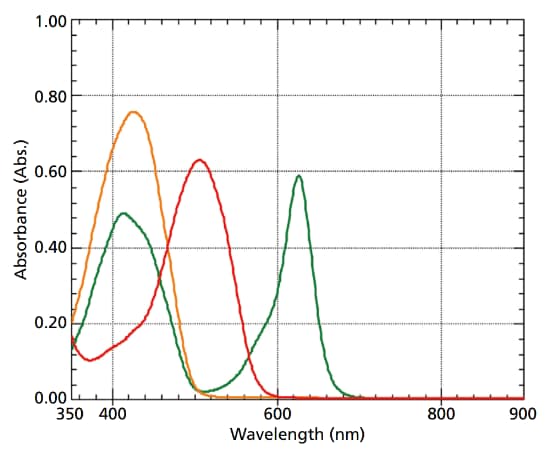
Absorption Spectra of Food Dyes
Pharmaceuticals and Life Sciences
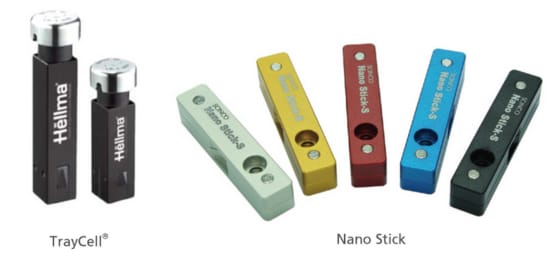
- This is an example of the analysis of λDNA. Trace quantities (on the order of a few µL) can be measured by combining the instrument with Nano Stick and TrayCell®. Using TrayCell, a calibration curve for 4 µL of λDNA was obtained in the range between 25 ng/μL and 500 ng/μL.
-
-
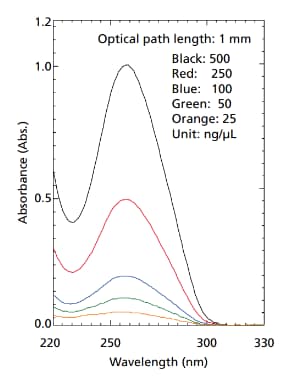
Spectrum of λDNA
-
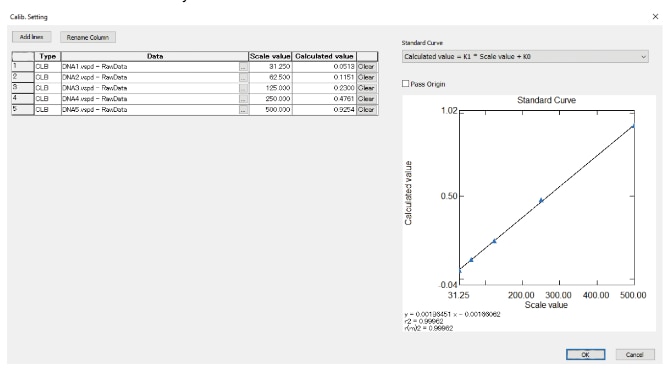
Calibration Curve of λDNA
Chemistry
Materials can be confirmed quantitatively by using LabSolutions UV-Vis and color measurement software.
LabSolutions UV-Vis color software shows the chromaticity diagram of the XY color system or Hazen color.
-
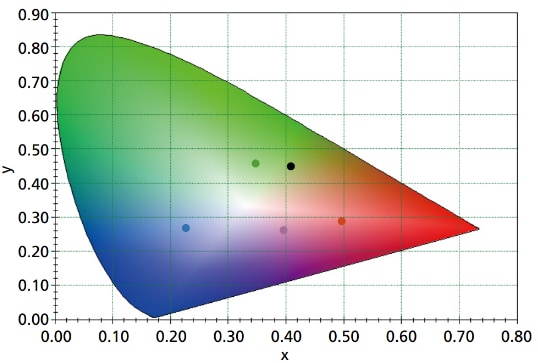
Chromaticity Diagram of XY Color System
-
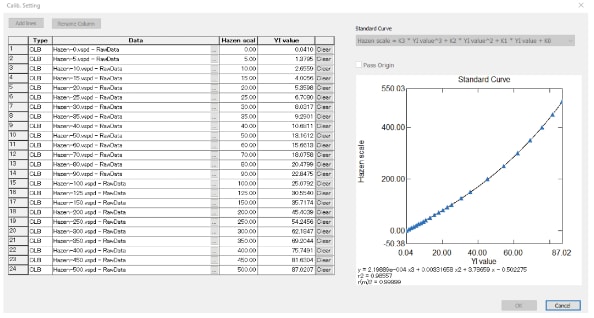
Calibration Curve of Hazen Color